3. Dashboard Overview
The Scribbler dashboard acts as an administrator's cockpit, providing a comprehensive analysis of:
- Resource utilization (CPU, RAM, Disk)
- Real-time logs
- Visual charts representing log severity and facility levels
Dashboard Widgets
The following table describes each widget available on the dashboard:
| Number | Item | Description |
|---|---|---|
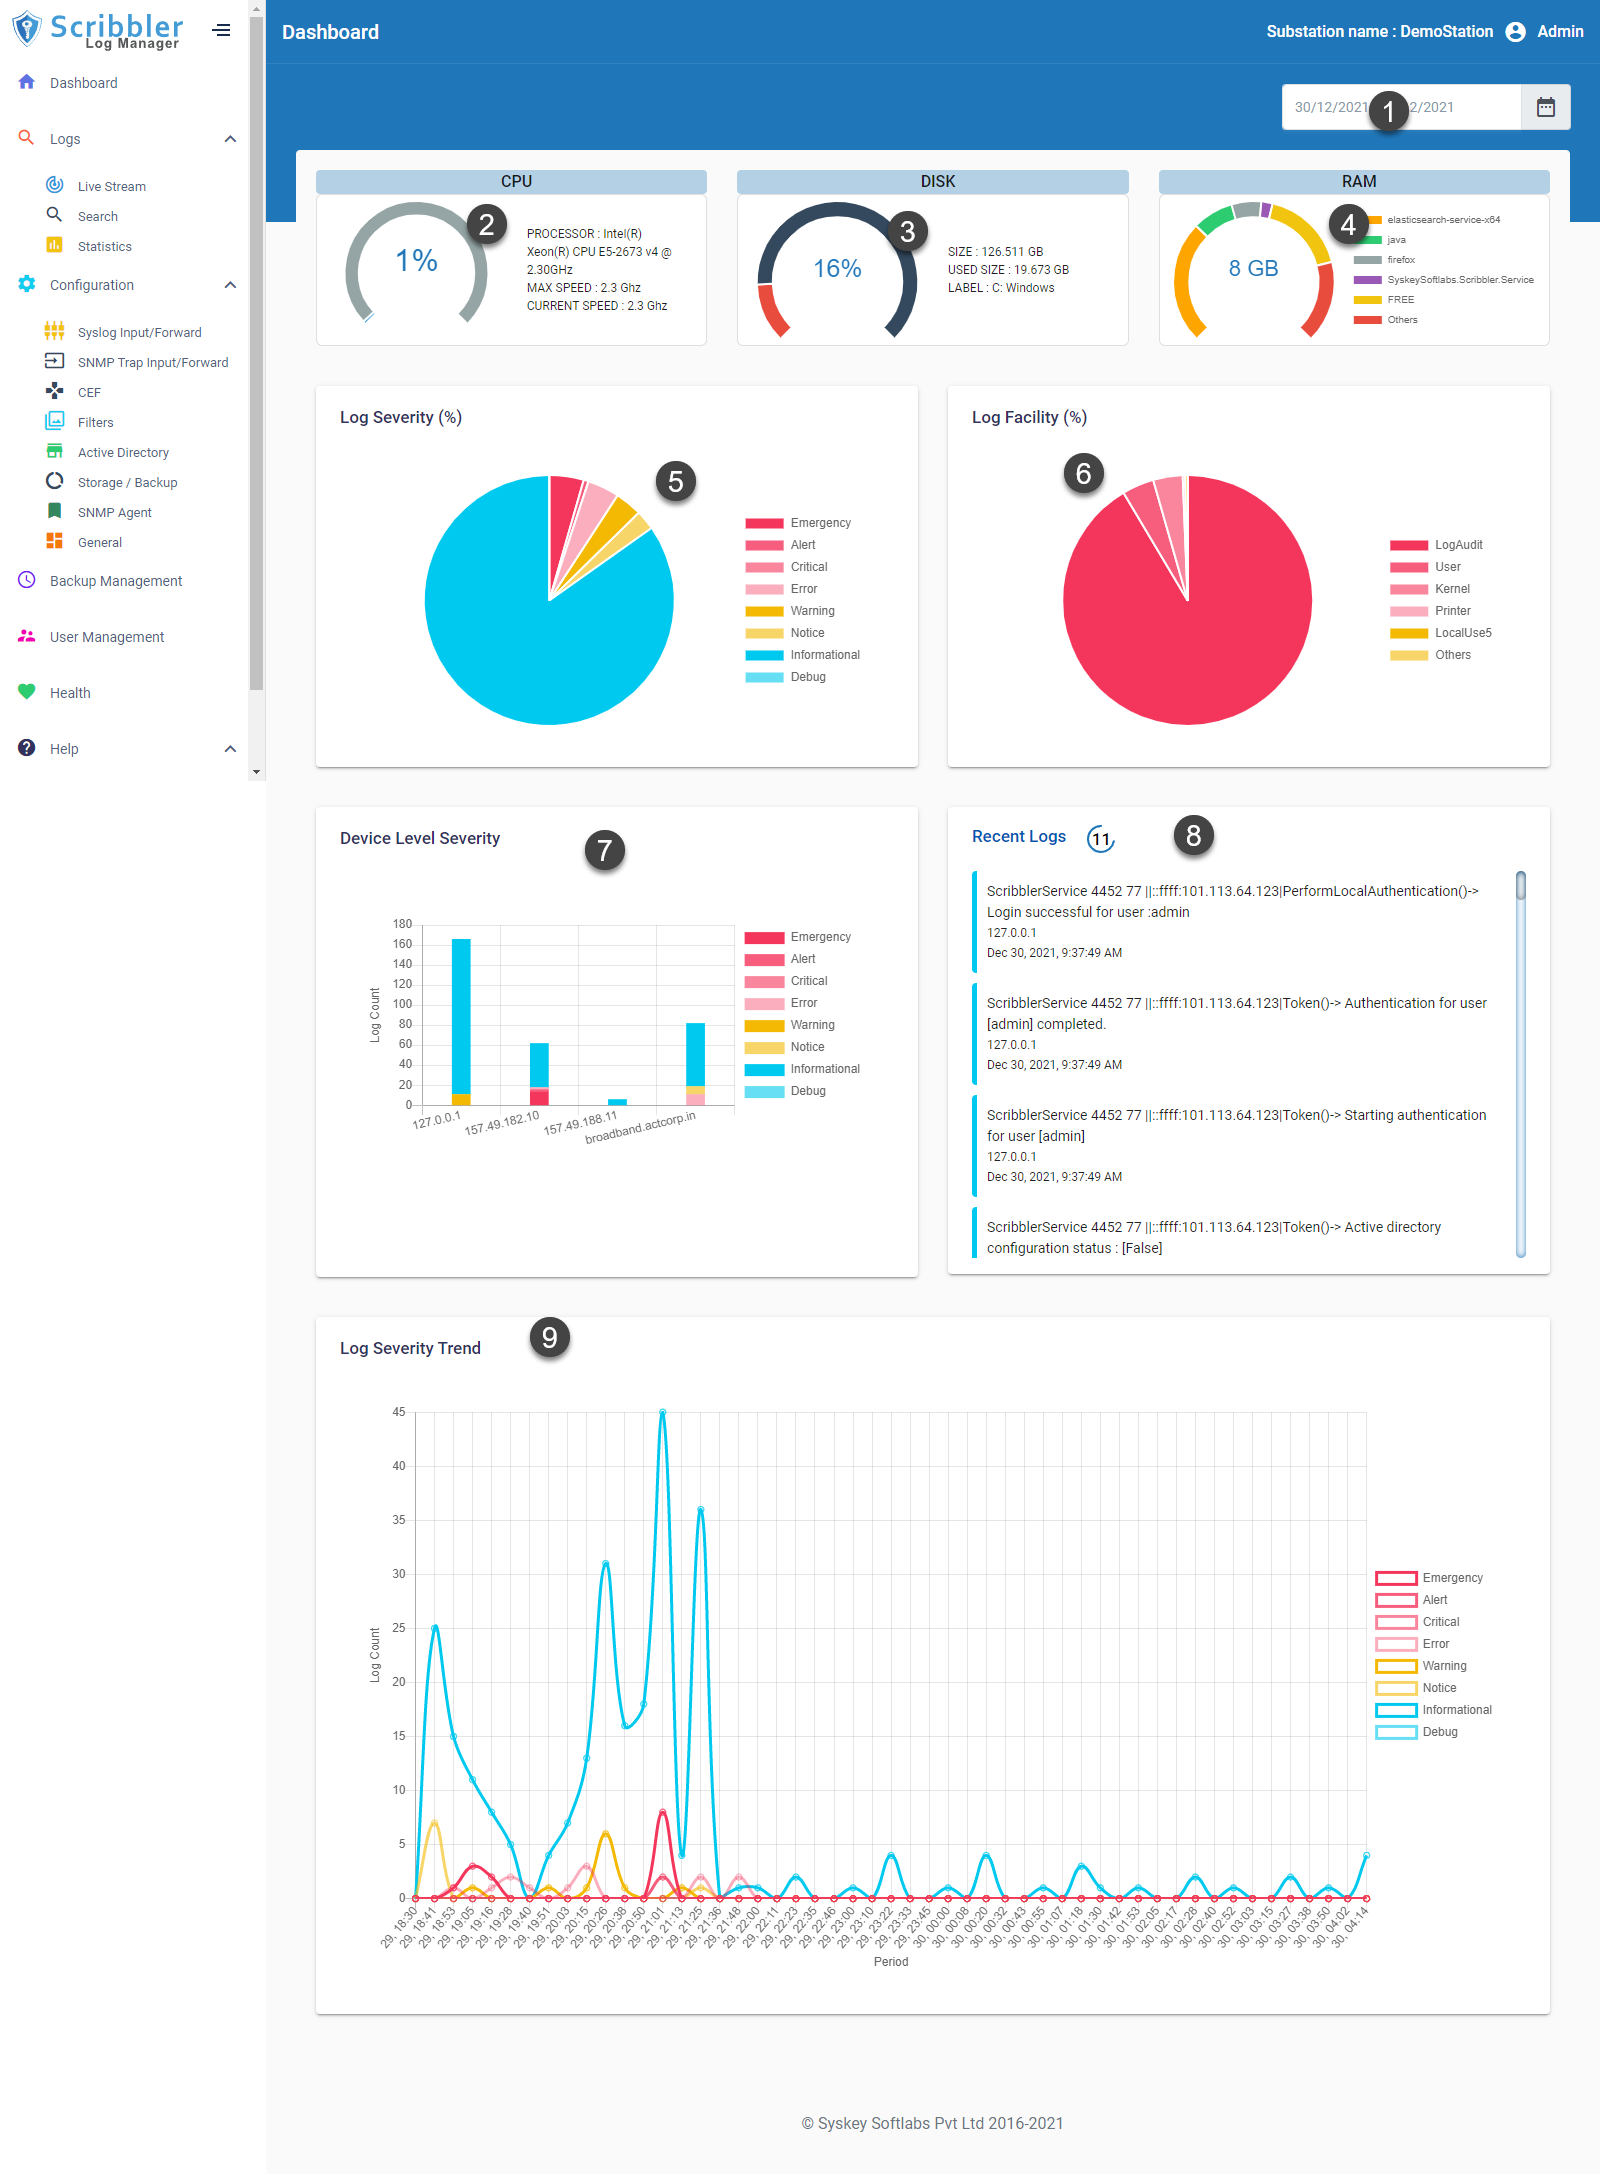
| 1 | Date Range | Dashboard data is updated according to the date range selected. The default date is Today. |
| 2 | CPU | Represents the CPU utilization of the server that is hosting Scribbler. |
| 3 | Disk | Represents the disk space utilization of the server that is hosting Scribbler. |
| 4 | RAM | Displays RAM usage details for the top seven applications on the Scribbler server. |
| 5 | Log Severity (%) | The pie chart displays the percentage distribution of log severity for the selected date range. The list shows the color associated with the severity level. Hover over the chart to view the severity level and percentage value.Click the severity level in the legend to remove or add that level from the chart. |
| 6 | Log Facility (%) | The pie chart displays the percentage distribution of logs by the top seven syslog facilities for the selected date range. Hover over the chart to view the severity level and percentage value. Click the facility in the legend to remove or add that level from the chart. |
| 7 | Device Level Severity | A bar graph with the top 10 devices on the X-axis and log counts on the Y-axis. The stacked bars are color-coded by severity level. |
| 8 | Recent Logs | Displays the latest 50 logs from the database, refreshed every 15 seconds. |
| 9 | Log Severity Trend | A bar graph displaying the trend of log severity levels over the selected time period. |